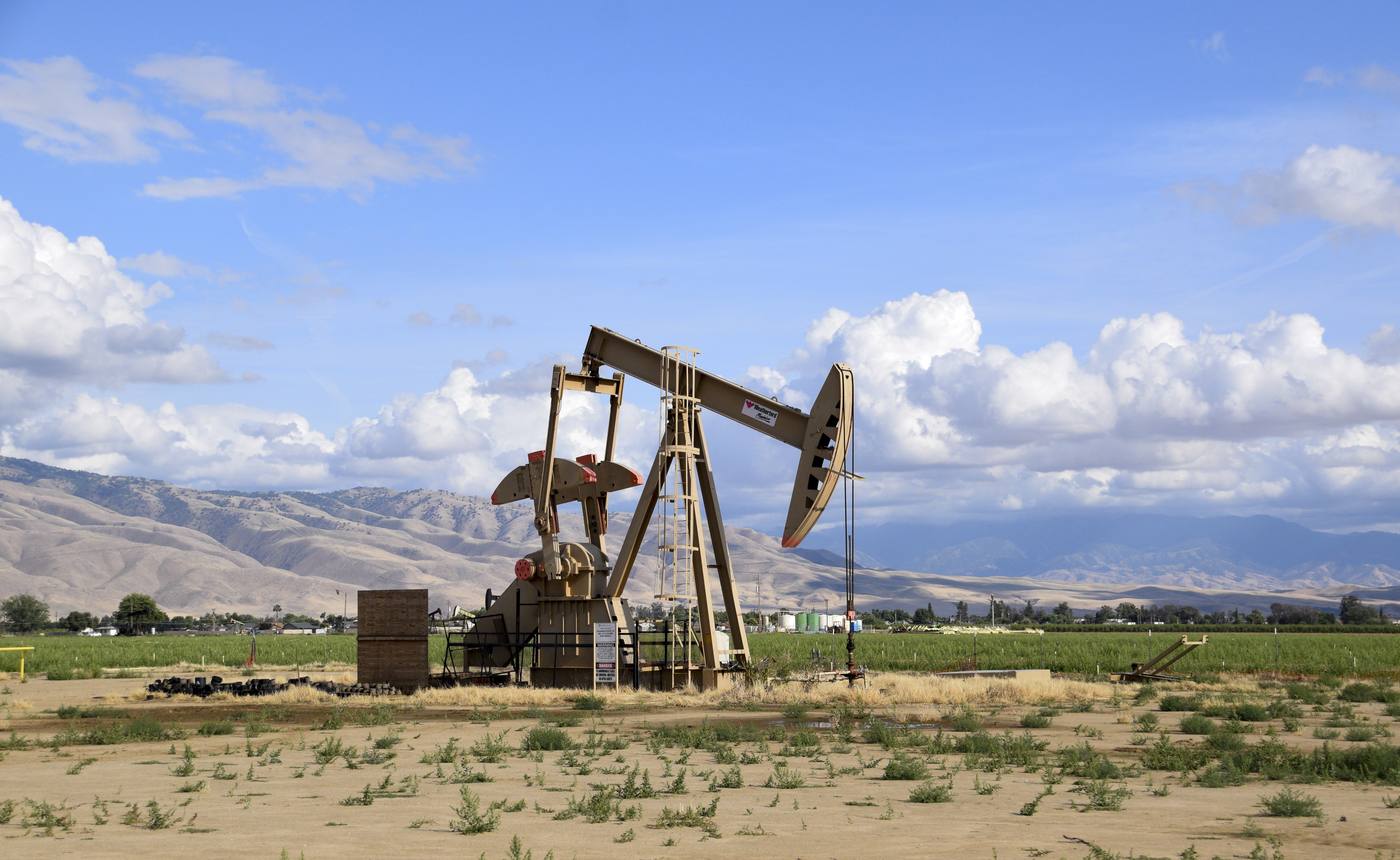
A $213.5 billion
machine.

Step outside the capitol and the bigger income statement is the whole economy. It grew 1.5% in real terms in 2025, and its engine room has diversified well beyond the derrick.

Oil still leads.
It no longer
stands alone.

Headline output and footprint by sector
  • Oil & gas, total footprint

    $60.3B

    $60.3B

    OERB, FY2024

  • Aerospace & defense

    $44.0B

    $44.0B

    206,000 jobs, anchored by Tinker

  • Government

    $32.8B

    $32.8B

    BEA value added

  • Real estate

    $23.5B

    $23.5B

    BEA value added

  • Tribal nations

    $23.4B

    $23.4B

    39 nations, 139,860 jobs

  • Professional & business

    $22.8B

    $22.8B

    BEA value added

  • Agriculture

    $6.1B

    $6.1B

    Top-5 US wheat and cattle

Where it ranks

  • Economy
  • People
  • Economy

    #6

    US crude-oil producer

    Also a major natural-gas state

  • Economy

    #3

    US wind-power producer

    About ten times its 2010 output

  • Economy

    206k

    Aerospace & defense jobs

    The country's largest air-logistics depot

  • Economy

    $7.8B

    Goods exports

    2024

    24.9% year over year

  • People

    $62,661

    Per-capita income

    40th in the US

  • Economy

    23%

    Economy from oil & gas

    The swing factor in tax receipts

What that means

The quiet story here is energy convergence. The same windy plains that made Oklahoma the sixth oil state now make it third in wind, and almost all of its electricity-generation growth since 2010 has been wind. Tinker Air Force Base seeded an aerospace cluster now worth $44 billion and 206,000 jobs.

Concentration cuts both ways. Oil and gas is still about 23% of all economic activity and the swing factor in state tax receipts. When crude rolls over, gross-production tax can fall half a billion dollars in a single year — which is exactly what happened in FY2024.

An acre is an acre
until you measure
what it earns.

Every one of Oklahoma's 77 counties, measured by assessed property value divided by land area. The range runs from $57 an acre in Cimarron, out in the panhandle, to $24,831 an acre in Oklahoma County — a 436-fold spread.

Hover or tap a county for its figure.

The extremes

Assessed value and value per acre, selected counties
CountyAssessed valueValue per acre
Oklahoma County$10.92B$24,831
Tulsa County$8.70B$23,175
Cleveland County$3.33B$9,508
Canadian County$2.38B$4,170
Mayes County$1.26B$2,967
Cimarron County$0.07B$57

Oklahoma and Tulsa counties together hold roughly 38% of the entire state property tax base on about 3% of its land. Infrastructure — roads, pipes, utilities — is built and maintained across the whole map, while the value that funds it concentrates in a few points. Every mile of new infrastructure is a long-term maintenance liability for the full tax base.

Not all spending
is equal.

When a dollar is spent at a locally-owned business, a measurably larger share recirculates within the community before it leaves. This is a documented economic effect, not an argument.

Estimated share of revenue that recirculates locally before leaving the state
  • Locally-owned business

    ~48%

    ~48%

    Owners, employees and suppliers all spend locally

  • National chain

    ~14%

    ~14%

    Profits leave for headquarters; supply chains are centralised

What Oklahoma buys
but does not make.

  • Technology & enterprise software

    IT infrastructure and digital services for government and business, largely sourced out of state.

  • Medical devices & pharmaceutical distribution

    Hospital supply chains dominated by out-of-state distributors.

  • Aerospace component manufacturing

    Oklahoma runs the world's largest overhaul operation. Most components are imported.

  • Value-added food processing

    Agricultural output leaves raw. Milling, packaging and specialty foods remain open.

  • Renewable energy components

    Third in the country for wind. Most turbine and solar components are imported.

  • Professional & consulting services

    Government and enterprise contracts flow significantly to out-of-state firms.

For this page

Sources & notes

Economy

U.S. Bureau of Economic Analysis (state GDP and by-industry, 2025, released April 2026); Oklahoma Energy Resources Board; U.S. Energy Information Administration; Oklahoma Department of Commerce; USDA; U.S. Census (exports, 2024).

Tribal economy

United for Oklahoma economic-impact report, 2023 data.

Land & property

Oklahoma Tax Commission, Ad Valorem Division — 2024 gross assessed valuation by county, divided by county land area.

Local recirculation

Institute for Local Self-Reliance, "The Economics of Local"; American Independent Business Alliance. Multiplier figures are ranges rather than point estimates.


On the sector figures. These mix BEA value-added (government, real estate, professional services) with total-activity and impact estimates (oil and gas, aerospace, tribal). They overlap and are not additive. They show relative heft, not a breakdown of GDP.

On value per acre. Value is 2024 gross assessed valuation from the Oklahoma Tax Commission divided by county land area. The table lists the extremes; the map covers all 77 counties.

On the import gaps. These state where demand exists alongside a local supply gap. No claim is made about why, or about who should fill them.

On correlation. This site does not draw causal conclusions between any two metrics. Where a relationship between data points appears, it is presented as correlation only. No figure here is offered as the cause of another.

On missing figures. Where something was never published, this site says so rather than guessing. A missing figure is never rendered as zero and never averaged around.

Last updated August 27, 2026. Data is compiled and built into the page when it is published. Corrections are welcome through the feedback button.